MeterSight power monitoring

See what your electrical system is doing right now.

Turn meter data into a clear operating view of live kW, voltage, current, power factor, demand, alarms and trends—organized around your electrical system.

Watch & explore

See MeterSight in action.

Watch the overview, then explore the solutions brochure for a closer look at Bronze, Silver and Gold.

MeterSight overview 2 minutes · Play with sound

More videos on YouTube →

Take a closer look

MeterSight Solutions Brochure

Utility visibility. Electrical insight. Connected operations. Explore the platform and its three packages in our full solutions brochure.

PDF · 15 pages · 6.5 MB

View brochure (opens a new tab) Download PDF
Put your switchgear on a screen

Meter data in system context.

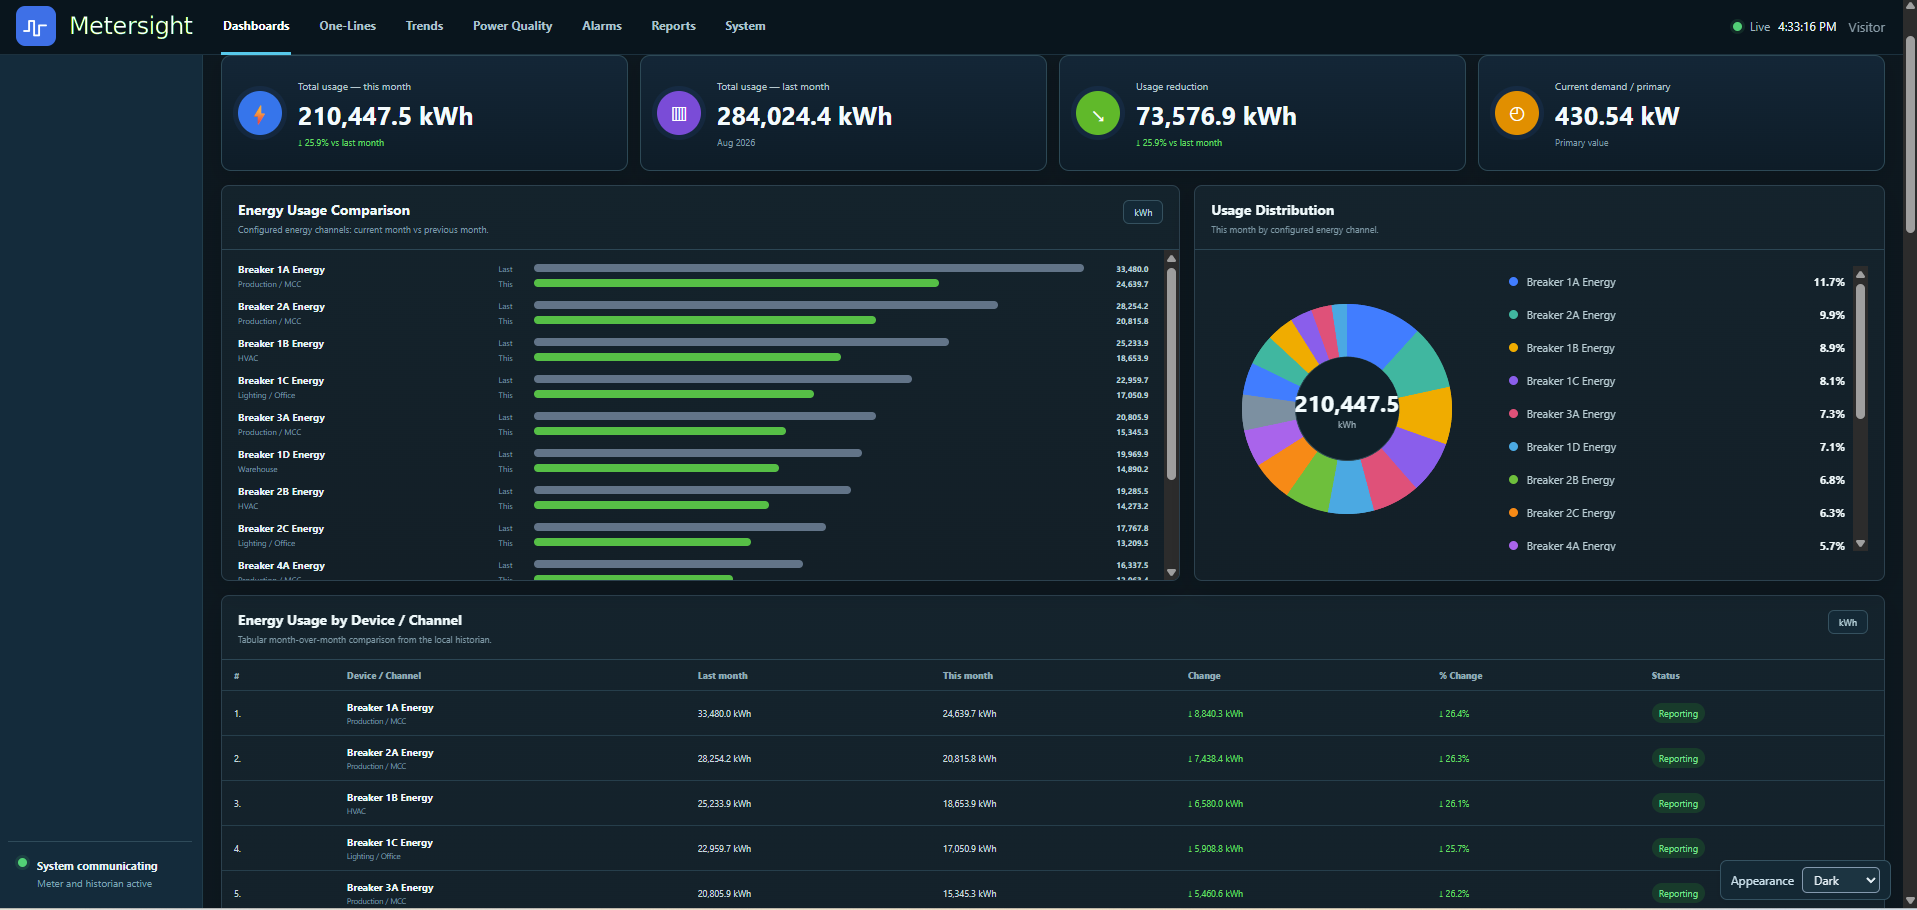
MeterSight brings connected electrical meters, equipment relationships, alarms and historical information into one clean interface. Start at a familiar one-line, locate the equipment that matters and drill into detailed readings without losing context.

It can support hospitals, data centers, manufacturing facilities, campuses, OEMs and EOEMs—anywhere teams need a faster path from electrical data to an informed decision.

MeterSight live energy and electrical dashboard showing monthly energy use, current demand, usage comparison, distribution and device-level data
Explore the live MeterSight demo dashboard.
The essential distinction

Energy tells you how much. Power tells you what is happening.

Seeing both gives facility teams a much clearer picture of consumption, loading and operating behavior.

kWh

Energy

Accumulated consumption

Energy is the total electricity used over time—the value typically associated with the utility bill.

Think of kWh like the total distance on a vehicle odometer.
kW

Power

Instantaneous demand

Power is the rate of electricity use right now. It helps reveal loading, peaks and sudden operational changes.

Think of kW like the speed shown on a speedometer.
Measured values

One view of the electrical measurements that matter.

Available measurements depend on the connected meter and project design.

01

Real power

Live kW for individual circuits, equipment and the overall facility.

02

Apparent & reactive power

kVA and kVAR for understanding total loading and reactive demand.

03

Voltage

VLL and VLN by phase, plus voltage imbalance where the meter supports it.

04

Current

Per-phase amps, loading and neutral current on supported systems.

05

Frequency

System frequency trends and out-of-range conditions.

06

Power factor

True and displacement power factor when provided by the meter.

07

Demand

Rolling or fixed-window demand for peak tracking and capacity planning.

08

Harmonics

Voltage and current THD for supported meters and power-quality applications.

Actionable alerts

Know when the system moves outside the plan.

Configurable alarms help teams focus on conditions that deserve attention instead of watching dashboards all day.

Demand threshold
Flag loads approaching a defined peak or capacity limit.
Low power factor
Identify inefficient loading and possible utility-penalty exposure.
Phase loss or imbalance
Surface abnormal phase conditions before they become larger problems.
Voltage tolerance
Alert when voltage moves above or below operating limits.
Meter communications
Know when a device stops reporting so visibility can be restored.
Trends, history & reporting

Move from a momentary reading to the full operating story.

Refresh and logging intervals can be configured to match project priorities and meter capabilities.

01

Historical trends

Compare shifts, days or seasons and investigate what changed before an event.

02

Peak demand

See when peaks occur and which monitored loads are contributing.

03

Reports & exports

Support recurring review with PDF or CSV outputs based on project configuration.

04

System one-lines

Navigate from a facility view to equipment and circuit-level measurements.

05

Multiple system types

Support single-phase, split-phase, three-phase and multi-circuit applications.

06

Meter integration

Build around supported meters from leading electrical manufacturers.

Frequently asked questions

What teams want to know before monitoring.

What does MeterSight show?

MeterSight can display live power, energy, phase voltage, current, power factor, demand, frequency, harmonics, alarms and historical trends based on the installed meters.

Why does power factor matter?

Low power factor can increase current, consume system capacity and contribute to utility penalties. Monitoring helps identify when and where it occurs.

Can it help investigate nuisance trips or electrical faults?

Historical loading, voltage and event context can help teams narrow the investigation. It complements—rather than replaces—protective-device studies and field diagnostics.

What types of electrical systems can be monitored?

Projects may include single-phase, split-phase, three-phase and multi-circuit metering, depending on the selected hardware and application.

How often does the data update?

Screen refresh and historical logging intervals are configurable and depend on the connected meters, network and project requirements.

Can the system send alarms?

Yes. Alarm logic and delivery can be configured around items such as demand, voltage, power factor, imbalance and communications status.
Bring us your meter list or electrical one-line.

CT Electrical Sales and Wasatch Automation can help map the meters, system views, alarms and reporting that fit your facility.

Select the right hardware

Need meters for your monitoring project?

Explore Socomec panel-mounted and enclosed metering options, or ask us to evaluate an alternative to your existing electrical meter.

Explore submetering & meter alternatives